Linear Momentum Conservation
Contents
Description of the Experiment
The didactics of this experiment is to teach users about concepts like reference frame, center of mass and conservation of linear momentum.
Besides conservation of momentum, this experiment also shows the collision in four different reference frames: those of the center of mass, of each vehicle and of Earth.
To achieve this, two cars are launched and will collide with each other and, while that happens, the control system calculates the speed at which the camera should move to film the reference frame chosen by the user.
By recording and reviewing the video, the user can see all the physical phenomena. The control room gives the inicial and final speeds of the cars.
Links
- Video: [unavailable]
- Laboratory: Basic in e-lab.ist.eu[1]
- Control room: [unavailable]
- Level: **
<swf height="270" width="480">http://www.elab.tecnico.ulisboa.pt/anexos/descricoes-flash/Colisione.swf</swf>
Who likes this idea
This idea is the result of the PEC26 contract with Ciência Viva - The Portuguese Agency for Cientific and Technological Culture - and its objectives are (i) sharing (through the internet) existing experimental setups available but not in use in some high-schools and (ii) promote teaching science through the use of experimental activities. The automation of the experiment was made by IST students as part of the e-lab project.
The first schools involved in this experiment were Escola Secundária Padre António Vieira, Alvalade/Lisboa and Externato Cooperativo da Benedita, Leiria. Escola Secundária Poeta Al Berto in Sines also colaborated.
Experimental Apparatus
The setup is composed of a hollow air rail with tiny holes that, along with an air compressor, creates an air flow. This air flow is equal along the rail (just like air hockey tables) and it allows the cars to slide with minimum friction. This rail is marked in segments of 100mm long blue rectangles that allow a complete and thorough study of the experiment, through image processing.
Two electromagnets (one at each end of the rail) made from linear solenoids and controlled by a micro-controller send a pre-configured pulse that launches the cars. The inicial speed of both cars are immediately measured by a photocell, by measuring the time the car flags interrupt the sensors.
Both cars A (209.8±0.5 gr) and B (234.6±0.5 gr) have two flags with a width of 10±0.2 mm, separated by 20±0.2 mm, that interrupt the cell one after the other. This "double measure" of time allows an estimation of the experimental error on the velocity.
The photo-gates are 1,500m±1mm apart.
The Cars
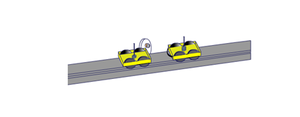
Despite its name, it doesn't look like a car at all. On the photo on the right we can see the 4 main parts:
- A metal triangle that fits on the rail;
- A rubber band in the front to make the collision as elastic as possible (it's impossible to create a perfectlly elastic collision, but this setup allows you to come close to it);
- A U-shaped flag on top that interacts with the photocells;
- A permanent magnet that will be repelled by the electromagnet, creating the pulse that starts the motion.
What's a photocell?
O photocell is a light sensor (photodiode) and a LED light. By measuring the time the flag interrupts the path between the two parts (emitter and receptor) and knowing the length of that part, we can determine the speed of the car.
Protocol
With this setup, the user can verify the conservation of linear momentum and kinetic energy in an elastic collision. To do this, the user must run the experiment with different starting pulses and observe the experiment in different reference frames.
To run the experiment, the following parameters must be defined:
- Pulse given to car A (as a percentage of maximum power);
- Pulse given to car B (same as above);
- Reference frame to observe the collision from (car A / car B / center of mass / laboratory).
The results given are the time each car flags interrupt the photogate, which can be used to determine the speed. From there, the user can calculate both the kinetic energy and the linear momentum (initial and final).
The video feed can be recorded using VLC or a similar software. An image analysis tool (like Tracker) can be used to further verify conservation of the physical quantities mentioned.
Advanced Protocol
The motor that launches each car is a solenoid to which an electric pulse is applied. The duration of the pulse is chosen by the user (by choosing the pulse percentage). The minimum value is 30% (corresponding to a 45ms pulse) to ensure the cars return to the starting point.
Based on the starting speeds and on the mass of the cars, the pulse created by each solenoid can be estimated. By running the experiment several times with different pulses the user can create a graphic relating the duration of the pulse with the average force created by the solenoid. Will the relation be linear?
The following data is needed to estimate the motor's efficiency:
- Applied voltage (to the solenoid): 8,5V
- Average current: 3,5A
- Pulse duration: [selected value (%)] \( \times \) 150ms


