Difference between revisions of "Langmuir Probe"
| (25 intermediate revisions by 5 users not shown) | |||
| Line 1: | Line 1: | ||
=Description of the Experiment= | =Description of the Experiment= | ||
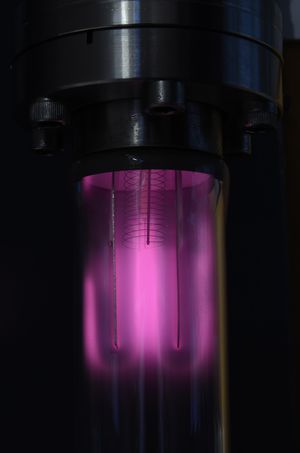
| − | [[File:Langmuir_with_plasma.jpg| | + | [[File:Langmuir_with_plasma.jpg|240|thumb|Fig. 1 - Photo of the experimental setup]] |
| − | Plasmas have different characteristics from other states of matter and many diagnostic tools have been developed in order to measure their parameters . | + | Plasmas have different characteristics from other states of matter and many diagnostic tools have been developed in order to measure their parameters. |
| − | This experiment allows the measurement of some of these characteristics using one of the most simple methods, an electrical probe, the Langmuir probe. It consists of a thin filament made of conductive material placed inside the plasma which either attracts or repels the electrons in the plasma | + | This experiment allows the measurement of some of these characteristics using one of the most simple methods, an electrical probe, the Langmuir probe. It consists of a thin filament made of a conductive material placed inside the plasma, which either attracts or repels the electrons in the plasma in accordance with its polarization. Measuring the probe I-V characteristic, that is the relationship between the polarization voltage and the respective collected current, you can determine the electron temperature and density of the plasma. |
<table style="background-color:white"><tr><td style="vertical-align:top"> | <table style="background-color:white"><tr><td style="vertical-align:top"> | ||
| − | <div class="toccolours mw-collapsible mw-collapsed" style="width: | + | <div class="toccolours mw-collapsible mw-collapsed" style="width:380px"> |
'''Links''' | '''Links''' | ||
<div class="mw-collapsible-content"> | <div class="mw-collapsible-content"> | ||
*Video: rtsp://elabmc.ist.utl.pt/langmuir.sdp | *Video: rtsp://elabmc.ist.utl.pt/langmuir.sdp | ||
| − | *Laboratory: Advanced | + | *Laboratory: Advanced |
| − | + | *Control room: [https://elab.vps.tecnico.ulisboa.pt:8002/execution/create/2/2 Langmuir Probe] | |
*Level: **** | *Level: **** | ||
| Line 21: | Line 21: | ||
<td style="vertical-align:top"> | <td style="vertical-align:top"> | ||
| − | <div class="toccolours mw-collapsible mw-collapsed" style="width: | + | <div class="toccolours mw-collapsible mw-collapsed" style="width:380px"> |
'''Videos''' | '''Videos''' | ||
<div class="mw-collapsible-content"> | <div class="mw-collapsible-content"> | ||
| − | {{# | + | {{#ev:youtube|EwK4Bn_7IVc|Glow discharg in Langmuir Probe experiment.|center}} |
</div> | </div> | ||
| Line 30: | Line 30: | ||
</td> | </td> | ||
</tr></table> | </tr></table> | ||
| + | |||
| + | WARNING: Due to overuse somethimes the experiment can lack on gas. Please be aware that if you can't reach a suitable pressure for a given injection time use a diferent gas or contact us by email to elab (at) tecnico (if you are human you will find out the email :-). | ||
=Experimental Apparatus= | =Experimental Apparatus= | ||
| − | <!--[[File:condensador-seccao.png|thumb| | + | <!--[[File:condensador-seccao.png|thumb|Fig. 2 Sectioned schematic of the capacitor, where a=12mm and b=16mm]]--> |
| − | The vacuum chamber consists of a Pyrex cylinder on which a glow discharge is produced by RF power. A tungsten filament with a diameter of 0.2mm is placed in the middle of the chamber partially isolated by an alumina cover and only a 10mm tip is exposed to the plasma acting as a Langmuir probe. This central filament | + | The vacuum chamber consists of a Pyrex cylinder on which a glow discharge is produced by RF power. A tungsten filament with a diameter of 0.2mm is placed in the middle of the chamber partially isolated by an alumina cover and only a 10mm tip is exposed to the plasma, acting as a Langmuir probe. This central filament has a ground reference around the probe with approximately 200mm, in order to be much longer than the probe itself. |
| − | The RF generator (3.5W, 50kHz, 1kV) | + | The RF generator (3.5W, 50kHz, 1kV) that ionizes the gas and generates the plasma is connected to two parallel molybdenum plates similar to a capacitor. |
| + | NOTE: Gas pressure correction should be computed according Pfeifer's vacuum gauge PPT100 spreadsheet. | ||
=Protocol= | =Protocol= | ||
| Line 42: | Line 45: | ||
==Determination of the electron temperature and density== | ==Determination of the electron temperature and density== | ||
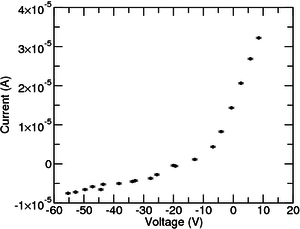
| − | [[File:Langmuir_Data_untreated_nograph.png|200|thumb| | + | [[File:Langmuir_Data_untreated_nograph.png|200|thumb|Fig. 2 - Raw Data of the experiment]] |
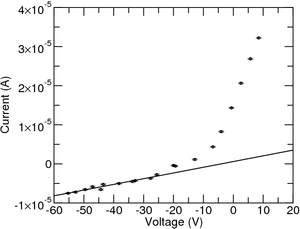
| − | [[File:Langmuir_Data_untreated.png|200|thumb| | + | [[File:Langmuir_Data_untreated.png|200|thumb|Fig. 3 - Linear fit to the ion saturation region]] |
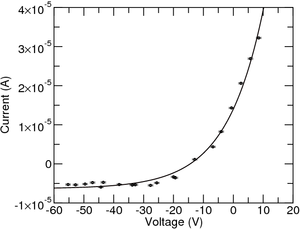
| − | [[File:Langmuir_Data_treated.png|200|thumb| | + | [[File:Langmuir_Data_treated.png|200|thumb|Fig. 4 - Fit to probe characteristic equation]] |
| − | The Langmuir probe uses one or more electrodes placed inside the plasma to measure the current collected while applying a voltage. This will provide the I-V characteristic for that plasma. Normally a triangular or sawtooth wave is used to get | + | The Langmuir probe uses one or more electrodes placed inside the plasma to measure the current collected while applying a voltage. This will provide the I-V characteristic for that plasma. Normally a triangular or sawtooth wave is used to get equiseparated points. |
| − | When the probe is electrically isolated, a plasma sheath is formed in the interface between the plasma and the probe. To compensate for the higher mobility of the electrons the probe will attain a floating potential,\(V_f\), negative | + | When the probe is electrically isolated, a plasma sheath is formed in the interface between the plasma and the probe. To compensate for the higher mobility of the electrons, the probe will attain a floating potential,\(V_f\), negative in relation to the plasma potential itself, \(V_p\). The density at the sheath entrance is roughly half of the density far away from the probe. |
| − | The probe voltage, \(V_s\) | + | The probe voltage, \(V_s\) is sweeped in relation to the ground winding filament, using a variable voltage source. If the polarization of the probe compared to the plasma potential is negative enough, all the electrons will be repelled and the ion flux to the probe is independent of the potential applied. In a totally ionized plasma, this ion saturation current is described by the following expression: |
| − | + | <math> i^+_{sat} = j^+_{sat} A_s = \frac{e \, n \, c_s \, A_s}{2} </math> | |
| − | + | Being \(j^+_{sat}\) the ion current density, \(A_s\) the contact surface of the probe, \(e\) the electron charge, \(n\) the ion density in the plasma, and \(c_s\) the ion sound speed. | |
| − | When the polarization applied to the probe | + | When the polarization applied to the probe increases, the voltage drop in the sheath is reduced and the electrons will be able to reach the probe. Taking a Maxwell distribution of the speed of the electrons, the relation between current and tension will be: |
| − | + | <math> i = -i^+_{sat} \left( 1- e^{\dfrac{e}{k T_e} (V_s - V_f)} \right) </math> | |
| − | + | Being \(T_e\) the electron temperature. This expression assumes that there is only one probe and that it is non-perturbative. | |
| − | From the last equation it is possible to extract an estimate | + | From the last equation it is possible to extract an estimate of the floating potential, \(V_f\). This is done by taking the value at which the characteristic crosses zero. |
| − | It will also be easily seen that the data does not follow the regular characteristic on the ion saturation side, it should be constant instead of having a slope. This has to do with the fact that the sheath thickness expands with the applied voltage. To correct | + | It will also be easily seen that the data does not follow the regular characteristic on the ion saturation side, it should be constant instead of having a slope. This has to do with the fact that the sheath thickness expands with the applied voltage. To correct this, a linear function is fitted on this side and the slope is subtracted (as seen in Figure 3). Alternatively you can include this contribution in the equation: |
| − | + | <math> i = -i^+_{sat} \left( 1- \alpha\ (V_s-V_f) - e^{\dfrac{e}{k T_e} (V_s - V_f)} \right) </math> | |
| + | However, when the goal is to get the density, another correction must be done, which corresponds to adding the value of current at the point where the current is completely due to ions, namely to voltage values much lower than the floating potential (in this case, use two times the floating potential, hence the need of the initial estimate). | ||
| − | + | After that, the experimental data has to be adjusted to the equation presented above (as seen in Figure 4). From the fit, the \(T_e\) can be extracted as well as the ion saturation current, \(i^+_{sat}\), and the floating potential, \(V_f\), which should have a value close to the one we determined empirically. | |
| − | + | By knowing the area of the probe and the speed of sound in the ions of the plasma, you can determine the electron density in the plasma. | |
| + | Since \(c_s = \sqrt{\dfrac{k T_e}{M}}\) and given that the probe is \(10mm\) and has a diameter of \(0.2mm\), you can use the \(i^+_{sat}\) to determine the density. | ||
| − | + | =Data analysis= | |
| − | + | Plasmas are a very energetic medium and measurements can be cumbersome and difficult to determine in particular on high pressures (above 1-10 Pa) . If we add to this fact the exponential behavior of the Langmuir characteristic, from a direct eye reading, is difficult to detect the exponential-only part of the characteristic. As such is recommended to plot the I/V curve in a semi-log scale after subtracting the ionic region. This leads to a graph without negative values which allows the use of logarithms. In such plots, the exponential is a clear straight line. Due to noise and fluctuations, to have a judicious guess, we must realize that the knee of the exponential emerges close to zero current values and to highlight such behavior one has to do a suitable and wise average of data points from several characteristics. | |
| + | |||
| + | Moreover, the use of a triangular sweep creates some hysteresis on the data acquisition process which is easily identified by a judicious over-plot of the odd and even parts from the sweep. Effectively the offset on the local plasma potential induced by the probe itself is different according to the voltage sweep edge and it's starting point (positive vs negative). It is strongly recommended to analyze separately this sweeps. | ||
| + | |||
| + | Be aware that log scales are very tricky to fool the eye and even more so numerical fittings... | ||
| + | |||
| + | =Bibliography= | ||
| + | *Principles of Plasma Diagnostics, Hutchinson, Cambridge. | ||
=Links= | =Links= | ||
| − | + | *[[Sonda_de_Langmuir | Portuguese version (Versão em Português)]] | |
| − | |||
Revision as of 14:02, 3 July 2023
Contents
Description of the Experiment
Plasmas have different characteristics from other states of matter and many diagnostic tools have been developed in order to measure their parameters. This experiment allows the measurement of some of these characteristics using one of the most simple methods, an electrical probe, the Langmuir probe. It consists of a thin filament made of a conductive material placed inside the plasma, which either attracts or repels the electrons in the plasma in accordance with its polarization. Measuring the probe I-V characteristic, that is the relationship between the polarization voltage and the respective collected current, you can determine the electron temperature and density of the plasma.
|
Links
|
Videos |
WARNING: Due to overuse somethimes the experiment can lack on gas. Please be aware that if you can't reach a suitable pressure for a given injection time use a diferent gas or contact us by email to elab (at) tecnico (if you are human you will find out the email :-).
Experimental Apparatus
The vacuum chamber consists of a Pyrex cylinder on which a glow discharge is produced by RF power. A tungsten filament with a diameter of 0.2mm is placed in the middle of the chamber partially isolated by an alumina cover and only a 10mm tip is exposed to the plasma, acting as a Langmuir probe. This central filament has a ground reference around the probe with approximately 200mm, in order to be much longer than the probe itself.
The RF generator (3.5W, 50kHz, 1kV) that ionizes the gas and generates the plasma is connected to two parallel molybdenum plates similar to a capacitor. NOTE: Gas pressure correction should be computed according Pfeifer's vacuum gauge PPT100 spreadsheet.
Protocol
Determination of the electron temperature and density
The Langmuir probe uses one or more electrodes placed inside the plasma to measure the current collected while applying a voltage. This will provide the I-V characteristic for that plasma. Normally a triangular or sawtooth wave is used to get equiseparated points.
When the probe is electrically isolated, a plasma sheath is formed in the interface between the plasma and the probe. To compensate for the higher mobility of the electrons, the probe will attain a floating potential,\(V_f\), negative in relation to the plasma potential itself, \(V_p\). The density at the sheath entrance is roughly half of the density far away from the probe.
The probe voltage, \(V_s\) is sweeped in relation to the ground winding filament, using a variable voltage source. If the polarization of the probe compared to the plasma potential is negative enough, all the electrons will be repelled and the ion flux to the probe is independent of the potential applied. In a totally ionized plasma, this ion saturation current is described by the following expression: [math] i^+_{sat} = j^+_{sat} A_s = \frac{e \, n \, c_s \, A_s}{2} [/math]
Being \(j^+_{sat}\) the ion current density, \(A_s\) the contact surface of the probe, \(e\) the electron charge, \(n\) the ion density in the plasma, and \(c_s\) the ion sound speed.
When the polarization applied to the probe increases, the voltage drop in the sheath is reduced and the electrons will be able to reach the probe. Taking a Maxwell distribution of the speed of the electrons, the relation between current and tension will be: [math] i = -i^+_{sat} \left( 1- e^{\dfrac{e}{k T_e} (V_s - V_f)} \right) [/math]
Being \(T_e\) the electron temperature. This expression assumes that there is only one probe and that it is non-perturbative.
From the last equation it is possible to extract an estimate of the floating potential, \(V_f\). This is done by taking the value at which the characteristic crosses zero.
It will also be easily seen that the data does not follow the regular characteristic on the ion saturation side, it should be constant instead of having a slope. This has to do with the fact that the sheath thickness expands with the applied voltage. To correct this, a linear function is fitted on this side and the slope is subtracted (as seen in Figure 3). Alternatively you can include this contribution in the equation:
[math] i = -i^+_{sat} \left( 1- \alpha\ (V_s-V_f) - e^{\dfrac{e}{k T_e} (V_s - V_f)} \right) [/math]
However, when the goal is to get the density, another correction must be done, which corresponds to adding the value of current at the point where the current is completely due to ions, namely to voltage values much lower than the floating potential (in this case, use two times the floating potential, hence the need of the initial estimate).
After that, the experimental data has to be adjusted to the equation presented above (as seen in Figure 4). From the fit, the \(T_e\) can be extracted as well as the ion saturation current, \(i^+_{sat}\), and the floating potential, \(V_f\), which should have a value close to the one we determined empirically.
By knowing the area of the probe and the speed of sound in the ions of the plasma, you can determine the electron density in the plasma. Since \(c_s = \sqrt{\dfrac{k T_e}{M}}\) and given that the probe is \(10mm\) and has a diameter of \(0.2mm\), you can use the \(i^+_{sat}\) to determine the density.
Data analysis
Plasmas are a very energetic medium and measurements can be cumbersome and difficult to determine in particular on high pressures (above 1-10 Pa) . If we add to this fact the exponential behavior of the Langmuir characteristic, from a direct eye reading, is difficult to detect the exponential-only part of the characteristic. As such is recommended to plot the I/V curve in a semi-log scale after subtracting the ionic region. This leads to a graph without negative values which allows the use of logarithms. In such plots, the exponential is a clear straight line. Due to noise and fluctuations, to have a judicious guess, we must realize that the knee of the exponential emerges close to zero current values and to highlight such behavior one has to do a suitable and wise average of data points from several characteristics.
Moreover, the use of a triangular sweep creates some hysteresis on the data acquisition process which is easily identified by a judicious over-plot of the odd and even parts from the sweep. Effectively the offset on the local plasma potential induced by the probe itself is different according to the voltage sweep edge and it's starting point (positive vs negative). It is strongly recommended to analyze separately this sweeps.
Be aware that log scales are very tricky to fool the eye and even more so numerical fittings...
Bibliography
- Principles of Plasma Diagnostics, Hutchinson, Cambridge.


