Difference between revisions of "File:Dft man.png"
Jump to navigation
Jump to search
(Transformada Discreta de Fourier calculada com dados obtidos de 12 Março a 20 de Agosto. Assinalado a vermelho está a harmónica principal (T=29 dias) e a amarelo as subharmónicas. Discrete Fourier Transform calculated with data obtained from 12th...) |
|||
| Line 1: | Line 1: | ||
| − | + | Espectro de Potência calculado com dados obtidos de 12 Março a 20 de Agosto. Assinalado a vermelho está a harmónica principal (T=29 dias) e a amarelo as subharmónicas. | |
| − | + | Power spectrum calculated with data obtained from 12th March to 20th of August. The red bar highlights the main harmonic (T=29 days) and the yellow bars highlight the subharmonics. | |
| − | The red bar highlights the main harmonic (T=29 days) and the yellow bars highlight the subharmonics. | ||
Latest revision as of 21:43, 10 October 2018
Espectro de Potência calculado com dados obtidos de 12 Março a 20 de Agosto. Assinalado a vermelho está a harmónica principal (T=29 dias) e a amarelo as subharmónicas.
Power spectrum calculated with data obtained from 12th March to 20th of August. The red bar highlights the main harmonic (T=29 days) and the yellow bars highlight the subharmonics.
File history
Click on a date/time to view the file as it appeared at that time.
| Date/Time | Thumbnail | Dimensions | User | Comment | |
|---|---|---|---|---|---|
| current | 21:42, 10 October 2018 | 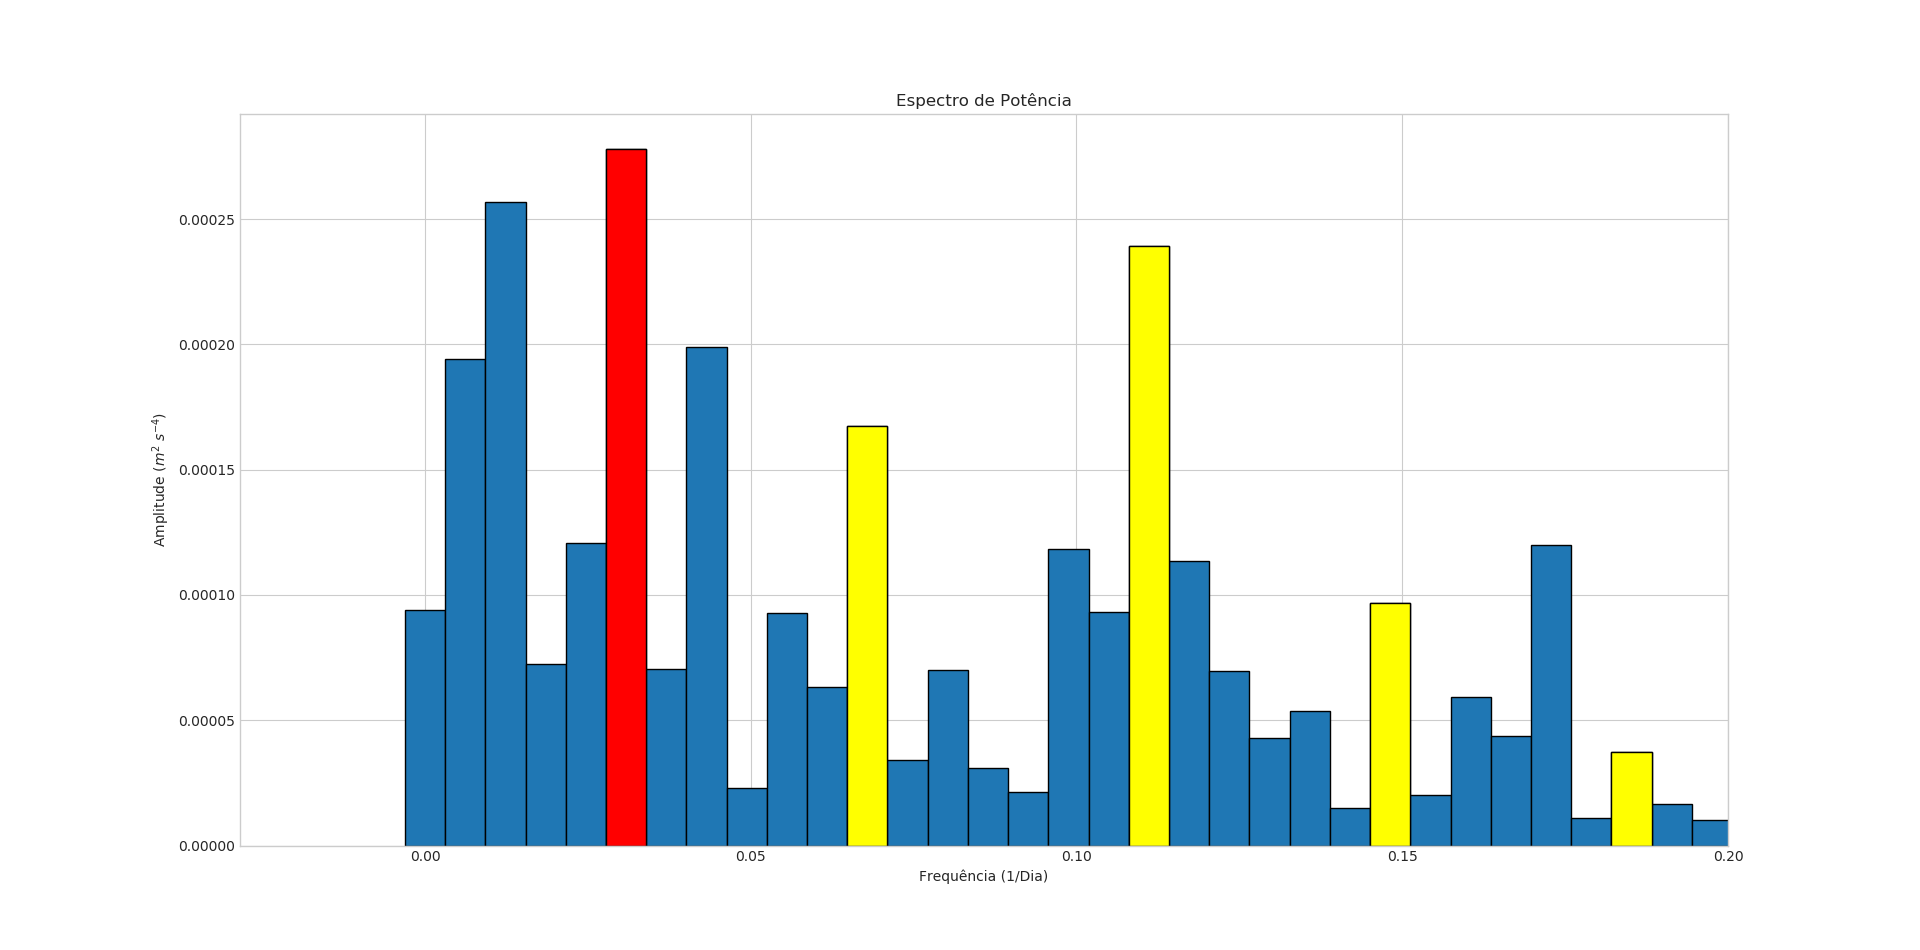 | 1,920 × 950 (33 KB) | Ist176128 (talk | contribs) | Transformada Discreta de Fourier calculada com dados obtidos de 12 Março a 20 de Agosto. Assinalado a vermelho está a harmónica principal (T=29 dias) e a amarelo as subharmónicas. Discrete Fourier Transform calculated with data obtained from 12th... |
You cannot overwrite this file.
File usage
The following 2 pages use this file: