Difference between revisions of "FREE - Framework for Remote Experiments in Education"
| (73 intermediate revisions by 2 users not shown) | |||
| Line 1: | Line 1: | ||
| + | |||
| + | = Current releases = | ||
| + | == Version 0.5.0 == | ||
| + | [[WPA_-_FREE_installation_instructions | Alpha release]] Major bugs corrected, adding video configuration and checking experiments status. | ||
| + | |||
| + | == Version 0.3.0 == | ||
| + | ([http://www.elab.tecnico.ulisboa.pt/wiki/index.php?title=FREE_(0.3.0) Bogotá release]) Test version including video server. | ||
= System architecture = | = System architecture = | ||
| − | In the defined architecture, users communicate with a central server, named | + | In the defined architecture, users communicate with a central server, named FREE_Web, through web pages. |
| − | This | + | This FREE_Web server contains the database with the results of the experiments already carried out and the experimental executions and experimental time schedules requested by users through the web interface. The FREE_Web server is also responsible for mediating real-time communication between users and experiences, exchanging configuration requests, status requests and responses and generated data between users actively connected to the apparatus and apparatus. |
<div style="display: inline; width: 520px; float: center;"> | <div style="display: inline; width: 520px; float: center;"> | ||
| Line 11: | Line 18: | ||
| − | Along with the experimental apparatus, a computer, named | + | Along with the experimental apparatus, a computer, named RPi_Proxy, acts as an interface between the controller of the experimental apparatus and the FREE_Web server. Each RPi_Proxy is turned on and represents one, and only one, experimental apparatus. It is important to note that this component was named RPi_Proxy because it is, in principle, implemented through the use of a Raspberry Pi, a computer that has communication modules necessary to communicate natively with the microcontrollers usually used to control the devices. However, this component can be implemented in other ways and it is only strictly necessary that it communicates according to the protocol - e.g. a virtual experience with data generated through a numerical model can implement this component with a normal computer without specialized interfaces. The communication between all components is done over the internet, with the exception of the communication between the RPi_Proxy and the experimental apparatus, where communications are made through the protocol that the controller of the apparatus implements. |
= Communication protocol = | = Communication protocol = | ||
| − | To start the connection between the | + | To start the connection between the RPi_Proxy and the FREE_Web, when the RPi_Proxy is turned on, it tries to connect to the FREE_Web server. If not successful, it should wait 10 seconds and try again until it manages to make the connection. |
<div style="display: flex;align-items: center;justify-content: center;"><ul> | <div style="display: flex;align-items: center;justify-content: center;"><ul> | ||
| Line 22: | Line 29: | ||
</div> | </div> | ||
| − | When the connection is successfully established, the server | + | When the connection is successfully established, the server RPi_Proxy sends to FREE_Webo its ID and Secret. These two variables are then checked on the FREE_Web server side as a simple way to authenticate that the connection is coming from an authorized machine. In case of successful verification, the FREE_Web responds to the RPi_Proxy with a message encoded in JSON format that describes the experience to be served by the RPi_Proxy. This configuration message allows the same RPi_Proxy program to be adaptable to different experiences with, for example, different numbers of actuators and sensors without changes to the source code. Based on the information contained in this message, the name of the config_file, the RPi_Proxy looks for the experiment at the indicated address and tries to establish communication with the controller of the experimental apparatus. In order to decouple the RPi_Proxy from the different communication protocols that each experimental controller may implement, the RPi_Proxy must communicate with the devices calling a set of standard methods whose implementation must be adapted to suit the target controller. |
| Line 28: | Line 35: | ||
| − | After this initial configuration, the connection of the | + | After this initial configuration, the connection of the RPi_Proxyao FREE_Weband the RPi_Proxyto the controller of the experiment, the system is ready for the exchange of messages between the components. The messages exchanged between components were defined following an everything is a string philosophy. Thus, the messages exchanged are JSON-formatted strings in which the JSON fields encode the message to be transmitted. The type of each message is identified by the msg_id field of the message JSON, and for the message sent, the reply, if any, must have reply_id with the same value. In order to be adaptable to various types of experimental apparatus, the system does not store apparatus status information so it is possible to send any of the defined messages at any time. The correct sequencing of messages for the successful operation of the apparatus is the responsibility of other user-controlled software layers. |
| + | = Functions documentation = | ||
| − | == | + | == FREE_Web == |
| − | == | + | == RPi_Proxy == |
| − | + | === interface.py(RPi_Proxy) === | |
| − | + | = How to install = | |
| − | |||
| − | |||
| − | |||
| − | |||
| − | |||
| − | + | == Pre-requisites == | |
| − | + | === Main server === | |
| − | + | For FREE_Web: | |
| − | + | * Git (2.30.2+) | |
| − | + | sudo apt install git | |
| − | + | * Python (3.7.0+) | |
| − | + | sudo apt install python3 | |
| + | sudo apt install python3-pip | ||
| − | + | There are need more installation but on the [https://github.com/e-lab-FREE/FREE_Web repository], you will have a "REQUIREMENTS.txt" that you will run to install them. | |
| + | |||
| − | + | For the video server: | |
| − | + | * Janus | |
| − | + | sudo apt install snap | |
| − | + | sudo apt install snapd | |
| − | + | sudo snap install janus-gateway | |
| − | |||
| − | |||
| − | + | For tools to test: | |
| + | * Flask | ||
| + | pip3 install flask | ||
| + | pip3 install flask_cors | ||
| − | === | + | === Rasberry Pi === |
| + | Operating System: | ||
| + | * Raspbian GNU/Linux 10 (buster) | ||
| + | For the Proxy it self: | ||
| + | * Python (3.7.0+) | ||
| + | sudo apt install python3 | ||
| + | sudo apt install python3-pip | ||
| + | sudo apt install python3-venv | ||
| + | pip3 install pyserial | ||
| + | * Git (2.30.2+) | ||
| + | sudo apt-get install git | ||
| − | + | For the video stream: | |
| + | sudo apt-get install gstreamer1.0-tools | ||
| + | sudo apt-get install gstreamer1.0-plugins-good | ||
| + | sudo apt-get install gstreamer1.0-plugins-bad | ||
| + | sudo apt-get install gstreamer1.0-plugins-ugly | ||
| + | sudo apt-get install gstreamer1.0-plugins-base | ||
| − | + | == Main Server (FREE_Web) == | |
| − | + | This software is the dispatcher of the information. By allowing the communications from the frontend and each RPi_Proxy responsible for an experience. To install this you need to install at least Python 3.7. | |
| − | |||
| − | |||
| − | |||
| − | |||
| − | + | Then go to the project on github https://github.com/e-lab-FREE/FREE_Web and follow the steps of installation that we present there. | |
| − | + | After the installation you will have the version of FREE 0.3.0 with a database and HTML page configured for a pendulum experiment as follow: | |
| − | |||
| − | |||
| − | |||
| − | |||
| − | |||
| − | |||
| − | < | + | <div style="display: flex;align-items: center;justify-content: center;"><ul> |
| − | + | <li style="display: inline-block; horizontal-align: center; "> [[File:FREE_Protocols.png|center|625px|thumb| Label ]] </li> | |
| − | + | <li style="display: inline-block; horizontal-align: center; "> [[File:FREE_Pendulum.png|center|600px|thumb| Label ]] </li> | |
| − | + | </ul> | |
| − | + | </div> | |
| − | |||
| − | </ | ||
| − | + | After confirming that this initial installation of FREE is run as expected (you obtained a similar page as shown above on your webpage), you can install a video stream serve if your experiment has a video camera connected to the computer, this computer needs to be able to connect to the main server via the internet (VPN, ...). | |
| − | |||
| − | + | === Janus stream server === | |
| − | + | To install the Janus stream server you will need to run the following commands on your Debian 11 machine: | |
| − | |||
| − | |||
| − | |||
| − | |||
| − | + | sudo apt install snap | |
| − | + | sudo apt install snapd | |
| − | |||
| − | |||
| − | |||
| − | |||
| − | |||
| − | + | sudo snap install janus-gateway | |
| − | + | After the installation of the Janus you will need to go to the folder of the configuration of Janus by: | |
| − | |||
| − | |||
| − | |||
| − | |||
| − | |||
| − | |||
| − | + | cd /var/snap/janus-gateway/common/etc | |
| − | + | and make delete every file that is not in this list: "janus.jcfg", "janus.plugin.streaming.jcfg", "janus.transport.http.jcfg" and "janus.transport.websockets.jcfg". | |
| − | + | Then edit the "janus.plugin.streaming.jcfg" and define an administration secret by uncommenting line 104. After that define the possible ports that Janus will use to receive the video stream from the source by uncomment line 106and put "rtp_port_ranges" for example to 6000-7000. | |
| − | + | After this, you can delete the sample endpoints by deleting all lines from line 124. And your Janus installation will be completed after restarting the Janus process by running the command: | |
| − | + | ||
| − | + | sudo snap restart janus-gateway | |
| − | |||
| − | |||
| − | + | Now to add new video stream ports before you will need to go back to your home folder and clone the repository: | |
| − | + | git clone https://github.com/e-lab-FREE/Video_Tester.git | |
| − | |||
| − | |||
| − | |||
| − | |||
| − | |||
| − | + | inside of this repository, you will find two python files for now we will focus on the "janus_tool.py", run it by typing the command: | |
| − | + | python3 janus_tool.py | |
| − | |||
| − | |||
| − | |||
| − | |||
| − | |||
| − | + | you will get the following interface on your command line: | |
| − | == | + | <div style="display: inline; width: 520px; float: center;"> |
| + | [[File:Janus_tools_interface.png|center|820px|thumb| Label. ]] </div> | ||
| + | |||
| + | By pressing "N", you can give a name to your stream and a description (this area just to help you distinguish the different streams). | ||
| + | |||
| + | |||
| + | <div style="display: inline; width: 520px; float: center;"> | ||
| + | [[File:Janus_tools_id_port.png|center|820px|thumb| Label. ]] </div> | ||
| − | + | After filling the info you will get a port and an ID as shown in the image above. This will be important when you will setup your RPi_Proxy. | |
| − | + | == Raspberry PI (RPI_Proxy) == | |
| − | |||
| − | |||
| − | |||
| − | |||
| − | + | First checkout the project from github (https://github.com/e-lab-FREE/RPi_Proxy), and you can get the code using: | |
| − | + | $ git clone https://github.com/e-lab-FREE/RPi_Proxy | |
| − | |||
| − | |||
| − | |||
| − | |||
| − | |||
| − | + | After following the installation guide on the github, you will get a version of the RPi_Proxy that is able to communicate with a pic experiment and it is configured in particular to communicate with a pic that performed a Pendulum experiment, for changing the experiment the only thing you need is to change the "experiment_details.py" on the pic_intreface folder. We have some of these files for different experiments such as the Langmuir on the following repository: [https://github.com/e-lab-FREE/pic_interface pic_interface]. | |
| − | + | It's possible to connect experiments that are not controlled with a pic, for example, we have on e-lab an experiment controlled by a Rasberry Pi. To do that it was needed to change the code on the "interface.py" but the name of the function need to be maintained. The code for this RPi_Proxy is presented on the following github: [https://github.com/e-lab-FREE/RPi_Proxy/tree/Cavity Cavity]. | |
| − | |||
| − | |||
| − | |||
| − | |||
| − | |||
| − | |||
| − | + | === Video capture and stream === | |
| − | + | This information is also on the github so if you follow all the github README.md of the repository "RPi_Proxy" you can sick this section. | |
| − | + | So after getting the Repository of the Proxy from [https://github.com/e-lab-FREE/RPi_Proxy/tree/Dev_Pendulum here] you will get a file called "start-video.sh" with the following structure: | |
| − | + | #!/bin/bash | |
| + | video_server= 0.0.0.0 | ||
| + | video_port= 6000 | ||
| + | usb_camera=/dev/video0 | ||
| + | video_width=1280 | ||
| + | video_height=720 | ||
| + | video_frame=30/1 | ||
| + | |||
| + | killall gst-launch-1.0 | ||
| + | gst-launch-1.0 v4l2src device=$usb_camera ! video/x-raw,width=$video_width,height=$video_height,framerate=$video_frame ! clockoverlay time-format="%x - %X" ! videoconvert ! omxh264enc ! h264parse ! rtph264pay config-interval=1 pt=96 ! udpsink host=$video_server port=$video_port async=false | ||
| − | + | so where you will need to put the port that you configured on the "janus_tool.py" for your experiment. And the video_server with the IP of your video server. | |
| − | + | One more thing needs to be checked on the "start-video.sh", the USB port where ur camera is connected, the resolution of it, and the frame rate. | |
| − | |||
| − | |||
| − | |||
| − | |||
| − | |||
| − | + | To check your resolution and USB connection these commands may help: | |
| − | + | v4l2-ctl --list-devices | |
| − | |||
| − | |||
| − | |||
| − | |||
| − | |||
| − | + | v4l2-ctl -d /dev/$your_dive$ --list-formats-ext | |
| − | + | After this you can run the following command to start the stream: | |
| − | |||
| − | |||
| − | |||
| − | |||
| − | |||
| − | |||
| − | + | sh start-video.sh | |
| − | === | + | ==== Accessing the stream ==== |
| − | + | After putting the start-video.sh process on you can go back to your video server and run the "janus_view_streams.py" this tool will help you to check if your webcam is streaming to the server. The "janus_view_streams.py" is a simple flask server that will run on your ip on the port 5001, if you don't want to run this tester on this port in particular you will need to edit the last line of the "janus_view_streams.py": | |
| + | app.run(debug=True, host= '0.0.0.0', port= 5001) | ||
| + | and change there the port. | ||
| − | + | After running the command: python3 janus_view_streams.py you will get the following page: | |
| − | |||
| − | |||
| − | |||
| − | |||
| − | |||
| − | = | + | <div style="display: inline; width: 520px; float: center;"> |
| + | [[File:Janus_view_page_1.png|center|1200px|thumb| Label. ]] </div> | ||
| − | + | And if you click on the second option you should be able to see your stream like this: | |
| − | < | + | <div style="display: inline; width: 520px; float: center;"> |
| − | + | [[File:Janus_view_page_2.png|center|900px|thumb| Label. ]] </div> | |
| − | |||
| − | |||
| − | |||
| − | |||
| − | </ | ||
| − | = | + | = How to add new experiments = |
| − | + | The first one has to have an experiment programmed in a controller of such experiment, after that and after installing the Proxy on a computer capable to communicate to the main server, the developer of the experiment needs to create the following entries on the database: Protocol, Experiment and Apparatuses. | |
| − | + | == Experiment == | |
| − | + | To create a new Experiment on the database is just click on the "+" on the left of the pag. | |
| − | + | <div style="display: inline; width: 520px; float: center;"> | |
| − | + | [[File:Experiment.png|center|1200px|thumb| Label. ]] </div> | |
| − | + | By doing that you we get to a similar pag as the above, so you need to fill the information about your experiment: | |
| − | |||
| − | |||
| − | </ | ||
| − | + | Name-> with the some of your experiment; | |
| − | + | Slug name-> the name of the html file of your experiment (explain on the section ...); | |
| − | + | Description-> the particular html with the description of the experiment, with the information that the user need to understand it; | |
| − | |||
| − | |||
| − | |||
| − | |||
| − | |||
| − | |||
| − | + | Configuration-> is a JSON with basic information that the Proxy needs to know about the experiment such as the serial port that is connected (for example in the case of the experiment Pendulum); | |
| − | + | Scientific area-> what area is the experience integrated; | |
| − | + | Lab type-> the background needed to execute the experiment (basic, intermedium, advance). | |
| − | |||
| − | |||
| − | |||
| − | |||
| − | |||
| − | |||
| − | = | + | == Protocol == |
| + | After finishing your Experiment you need to create a new Protocol to do that again click on the "+" next to the Protocols tab on the left. | ||
| + | |||
| + | Every Experiment should have at least one Protocol. A Protocol is a way to describe the parameters that a user can select and modify to run an experimental execution. One physical setup of an experimental can do different execution with different initial parameters so that is why one experiment can have multiple Protocols. | ||
| + | |||
| + | <div style="display: inline; width: 520px; float: center;"> | ||
| + | [[File:Protocols.png|center|1200px|thumb| Label. ]] </div> | ||
| + | |||
| + | You will have a page like the one shown above that you will need to file: | ||
| + | |||
| + | Experiment-> select your exeperiment; | ||
| + | |||
| + | Name-> with the name of the protocol, this name should be descriptive of the experimental setup that the controller will use. That you can translate; | ||
| + | |||
| + | Configuration-> this is a JSON schema that will test the inputs that the user will give, and check that their configuration are within the range of the experiment ( You can do your JSON Schema [https://bjdash.github.io/JSON-Schema-Builder/ here]). | ||
| + | |||
| + | == Apparatuses == | ||
| + | |||
| + | After programing the Protocols one last thing needs to be done on the database. You need to provide to the database the information of the Apparatus (the computer witch will connect to the FREE_Web). | ||
| + | |||
| + | <div style="display: inline; width: 520px; float: center;"> | ||
| + | [[File:Aparatus.png|center|1200px|thumb| Label. ]] </div> | ||
| + | |||
| + | You will have a similar page as a shown above, so you need to fill the follow information: | ||
| − | + | Experiment-> the one experiment that apparatus is connected to; | |
| − | + | Protocol-> the protocols related that Experiment; | |
| − | + | Location-> Location of the experiment; | |
| − | |||
| − | + | Secret-> the password that you need to configure and the "server_info.ini" on the RPi_Proxy; | |
| − | |||
| − | + | Owner-> the person responsible for the maintenance of the experiment; | |
| − | + | Video Configuration -> the ID that the Port of the stream of the video is connected to the server of Janus (explained in the section ...). | |
| − | |||
| − | |||
| − | + | == HTML/JS == | |
| − | + | With the FREE installed you will have the following page to run an experiment Pendulum, basically it starts with a discretion that is on the database: | |
| − | + | <div style="display: inline; width: 520px; float: center;"> | |
| − | + | [[File:Elab_page_1.png|center|820px|thumb| Label. ]] </div> | |
| − | |||
| − | |||
| − | |||
| − | + | Then you can go to the Configuration tab and set up the initial condition of the experiment, and after Save and Submit the configuration | |
| − | + | <div style="display: inline; width: 520px; float: center;"> | |
| + | [[File:Elab_page_2.png|center|820px|thumb| Label. ]] </div> | ||
| − | + | you will be sent to the tab Execution where you will be able to see the video stream and the plot of the data sent by the experiment. | |
| − | = | + | <div style="display: inline; width: 520px; float: center;"> |
| − | + | [[File:Elab_page_3.png|center|820px|thumb| Label. ]] </div> | |
| − | |||
| − | + | To finalize the process of creating a new experiment and adding it to the FREE you will need to do an HTML and JS similar to the one that we provide for the Pendulum experiment. Basically, you will need to add as much inputs on the Configuration tab, and change the JS that is plotting, and put the data point on a table so it displays the data points of your experiment. | |
| − | |||
| − | + | <div style="display: flex;align-items: center;justify-content: center;"><ul> | |
| − | + | <li style="display: inline-block; horizontal-align: center; "> [[File:FREE_templates.png|center|820px|thumb| Label. ]] </li> | |
| − | + | <li style="display: inline-block; horizontal-align: center; "> [[File:FREE_static.png|center|253px|thumb| Label. ]] </li> | |
| − | + | </ul> | |
| − | + | </div> | |
| − | After that you need to | + | After you make sure that everything is working as intended you need to add the HTML fill on the "/free/templates/free/experiments" folder and make sure that the name of the file is the same as the Slug that you put on the database ($Slug_name$.html) and the JS, image and CSS file that you need to display the HTML you will need to add them to the respective folders on the folder "/free/static/free". |
| − | + | <!--= Video Streaming = --!> | |
| − | + | Intro | |
| − | + | == Video capture and stream == | |
| − | |||
| − | |||
| − | |||
| − | |||
| − | |||
| − | |||
| − | |||
| − | |||
| − | |||
| − | + | On the raspberry it is running .... | |
| − | + | == Janus stream server == | |
| − | + | == Accessing the stream == | |
| − | + | The experiment stream can be access by a html .... | |
| − | + | or by using VLC, allowing to grab the video | |
Latest revision as of 09:35, 1 June 2022
Contents
Current releases
Version 0.5.0
Alpha release Major bugs corrected, adding video configuration and checking experiments status.
Version 0.3.0
(Bogotá release) Test version including video server.
System architecture
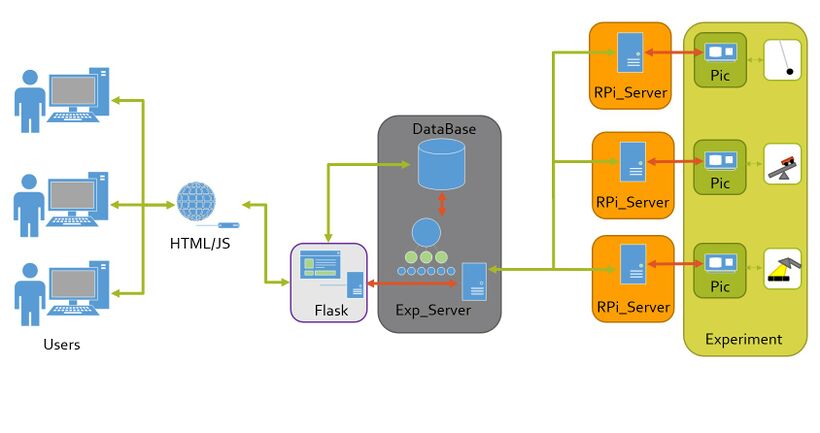
In the defined architecture, users communicate with a central server, named FREE_Web, through web pages.
This FREE_Web server contains the database with the results of the experiments already carried out and the experimental executions and experimental time schedules requested by users through the web interface. The FREE_Web server is also responsible for mediating real-time communication between users and experiences, exchanging configuration requests, status requests and responses and generated data between users actively connected to the apparatus and apparatus.
Along with the experimental apparatus, a computer, named RPi_Proxy, acts as an interface between the controller of the experimental apparatus and the FREE_Web server. Each RPi_Proxy is turned on and represents one, and only one, experimental apparatus. It is important to note that this component was named RPi_Proxy because it is, in principle, implemented through the use of a Raspberry Pi, a computer that has communication modules necessary to communicate natively with the microcontrollers usually used to control the devices. However, this component can be implemented in other ways and it is only strictly necessary that it communicates according to the protocol - e.g. a virtual experience with data generated through a numerical model can implement this component with a normal computer without specialized interfaces. The communication between all components is done over the internet, with the exception of the communication between the RPi_Proxy and the experimental apparatus, where communications are made through the protocol that the controller of the apparatus implements.
Communication protocol
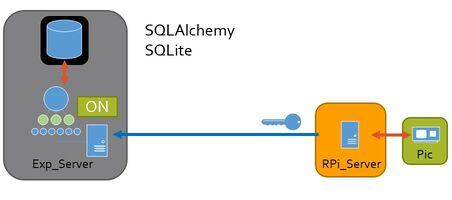
To start the connection between the RPi_Proxy and the FREE_Web, when the RPi_Proxy is turned on, it tries to connect to the FREE_Web server. If not successful, it should wait 10 seconds and try again until it manages to make the connection.
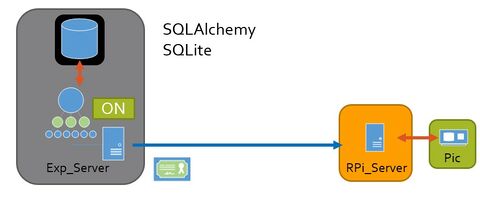
When the connection is successfully established, the server RPi_Proxy sends to FREE_Webo its ID and Secret. These two variables are then checked on the FREE_Web server side as a simple way to authenticate that the connection is coming from an authorized machine. In case of successful verification, the FREE_Web responds to the RPi_Proxy with a message encoded in JSON format that describes the experience to be served by the RPi_Proxy. This configuration message allows the same RPi_Proxy program to be adaptable to different experiences with, for example, different numbers of actuators and sensors without changes to the source code. Based on the information contained in this message, the name of the config_file, the RPi_Proxy looks for the experiment at the indicated address and tries to establish communication with the controller of the experimental apparatus. In order to decouple the RPi_Proxy from the different communication protocols that each experimental controller may implement, the RPi_Proxy must communicate with the devices calling a set of standard methods whose implementation must be adapted to suit the target controller.
(TODO)
After this initial configuration, the connection of the RPi_Proxyao FREE_Weband the RPi_Proxyto the controller of the experiment, the system is ready for the exchange of messages between the components. The messages exchanged between components were defined following an everything is a string philosophy. Thus, the messages exchanged are JSON-formatted strings in which the JSON fields encode the message to be transmitted. The type of each message is identified by the msg_id field of the message JSON, and for the message sent, the reply, if any, must have reply_id with the same value. In order to be adaptable to various types of experimental apparatus, the system does not store apparatus status information so it is possible to send any of the defined messages at any time. The correct sequencing of messages for the successful operation of the apparatus is the responsibility of other user-controlled software layers.
Functions documentation
FREE_Web
RPi_Proxy
interface.py(RPi_Proxy)
How to install
Pre-requisites
Main server
For FREE_Web:
- Git (2.30.2+)
sudo apt install git
- Python (3.7.0+)
sudo apt install python3
sudo apt install python3-pip
There are need more installation but on the repository, you will have a "REQUIREMENTS.txt" that you will run to install them.
For the video server:
- Janus
sudo apt install snap sudo apt install snapd sudo snap install janus-gateway
For tools to test:
- Flask
pip3 install flask pip3 install flask_cors
Rasberry Pi
Operating System:
- Raspbian GNU/Linux 10 (buster)
For the Proxy it self:
- Python (3.7.0+)
sudo apt install python3 sudo apt install python3-pip sudo apt install python3-venv pip3 install pyserial
- Git (2.30.2+)
sudo apt-get install git
For the video stream:
sudo apt-get install gstreamer1.0-tools
sudo apt-get install gstreamer1.0-plugins-good
sudo apt-get install gstreamer1.0-plugins-bad
sudo apt-get install gstreamer1.0-plugins-ugly
sudo apt-get install gstreamer1.0-plugins-base
Main Server (FREE_Web)
This software is the dispatcher of the information. By allowing the communications from the frontend and each RPi_Proxy responsible for an experience. To install this you need to install at least Python 3.7.
Then go to the project on github https://github.com/e-lab-FREE/FREE_Web and follow the steps of installation that we present there.
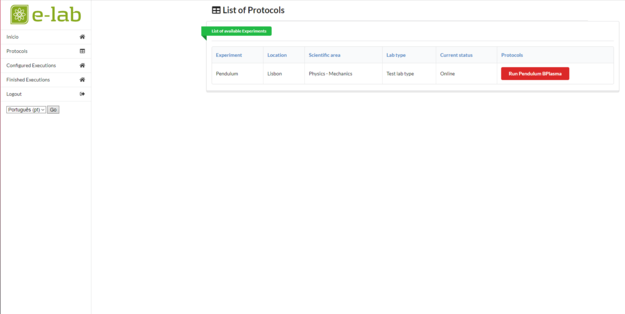
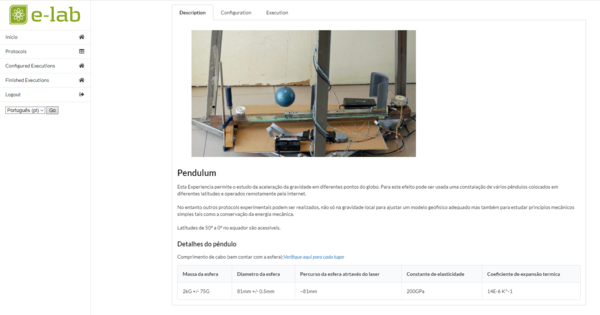
After the installation you will have the version of FREE 0.3.0 with a database and HTML page configured for a pendulum experiment as follow:
After confirming that this initial installation of FREE is run as expected (you obtained a similar page as shown above on your webpage), you can install a video stream serve if your experiment has a video camera connected to the computer, this computer needs to be able to connect to the main server via the internet (VPN, ...).
Janus stream server
To install the Janus stream server you will need to run the following commands on your Debian 11 machine:
sudo apt install snap
sudo apt install snapd
sudo snap install janus-gateway
After the installation of the Janus you will need to go to the folder of the configuration of Janus by:
cd /var/snap/janus-gateway/common/etc
and make delete every file that is not in this list: "janus.jcfg", "janus.plugin.streaming.jcfg", "janus.transport.http.jcfg" and "janus.transport.websockets.jcfg".
Then edit the "janus.plugin.streaming.jcfg" and define an administration secret by uncommenting line 104. After that define the possible ports that Janus will use to receive the video stream from the source by uncomment line 106and put "rtp_port_ranges" for example to 6000-7000.
After this, you can delete the sample endpoints by deleting all lines from line 124. And your Janus installation will be completed after restarting the Janus process by running the command:
sudo snap restart janus-gateway
Now to add new video stream ports before you will need to go back to your home folder and clone the repository:
git clone https://github.com/e-lab-FREE/Video_Tester.git
inside of this repository, you will find two python files for now we will focus on the "janus_tool.py", run it by typing the command:
python3 janus_tool.py
you will get the following interface on your command line:
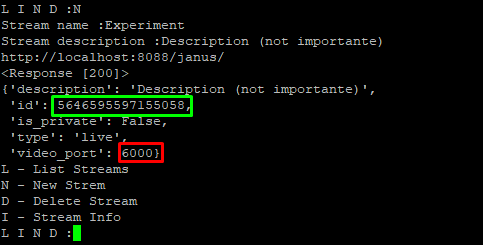
By pressing "N", you can give a name to your stream and a description (this area just to help you distinguish the different streams).
After filling the info you will get a port and an ID as shown in the image above. This will be important when you will setup your RPi_Proxy.
Raspberry PI (RPI_Proxy)
First checkout the project from github (https://github.com/e-lab-FREE/RPi_Proxy), and you can get the code using:
$ git clone https://github.com/e-lab-FREE/RPi_Proxy
After following the installation guide on the github, you will get a version of the RPi_Proxy that is able to communicate with a pic experiment and it is configured in particular to communicate with a pic that performed a Pendulum experiment, for changing the experiment the only thing you need is to change the "experiment_details.py" on the pic_intreface folder. We have some of these files for different experiments such as the Langmuir on the following repository: pic_interface.
It's possible to connect experiments that are not controlled with a pic, for example, we have on e-lab an experiment controlled by a Rasberry Pi. To do that it was needed to change the code on the "interface.py" but the name of the function need to be maintained. The code for this RPi_Proxy is presented on the following github: Cavity.
Video capture and stream
This information is also on the github so if you follow all the github README.md of the repository "RPi_Proxy" you can sick this section.
So after getting the Repository of the Proxy from here you will get a file called "start-video.sh" with the following structure:
#!/bin/bash
video_server= 0.0.0.0
video_port= 6000
usb_camera=/dev/video0
video_width=1280
video_height=720
video_frame=30/1

killall gst-launch-1.0
gst-launch-1.0 v4l2src device=$usb_camera ! video/x-raw,width=$video_width,height=$video_height,framerate=$video_frame ! clockoverlay time-format="%x - %X" ! videoconvert ! omxh264enc ! h264parse ! rtph264pay config-interval=1 pt=96 ! udpsink host=$video_server port=$video_port async=false
so where you will need to put the port that you configured on the "janus_tool.py" for your experiment. And the video_server with the IP of your video server. One more thing needs to be checked on the "start-video.sh", the USB port where ur camera is connected, the resolution of it, and the frame rate.
To check your resolution and USB connection these commands may help:
v4l2-ctl --list-devices
v4l2-ctl -d /dev/$your_dive$ --list-formats-ext
After this you can run the following command to start the stream:
sh start-video.sh
Accessing the stream
After putting the start-video.sh process on you can go back to your video server and run the "janus_view_streams.py" this tool will help you to check if your webcam is streaming to the server. The "janus_view_streams.py" is a simple flask server that will run on your ip on the port 5001, if you don't want to run this tester on this port in particular you will need to edit the last line of the "janus_view_streams.py":
app.run(debug=True, host= '0.0.0.0', port= 5001)
and change there the port.
After running the command: python3 janus_view_streams.py you will get the following page:
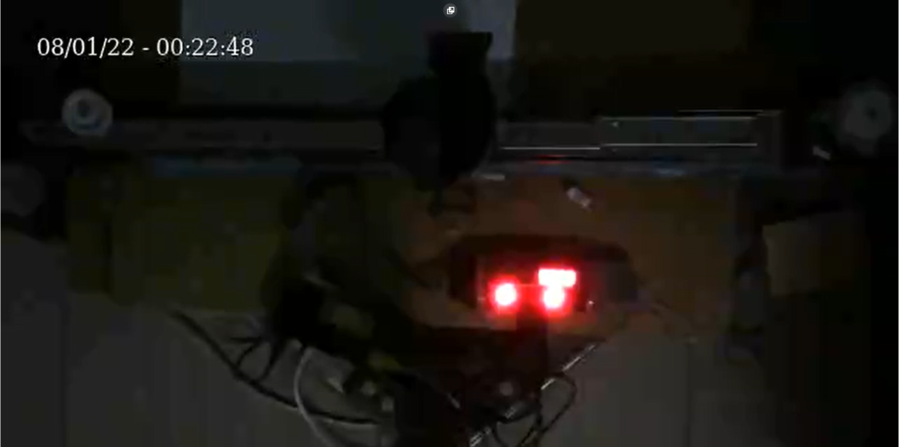
And if you click on the second option you should be able to see your stream like this:
How to add new experiments
The first one has to have an experiment programmed in a controller of such experiment, after that and after installing the Proxy on a computer capable to communicate to the main server, the developer of the experiment needs to create the following entries on the database: Protocol, Experiment and Apparatuses.
Experiment
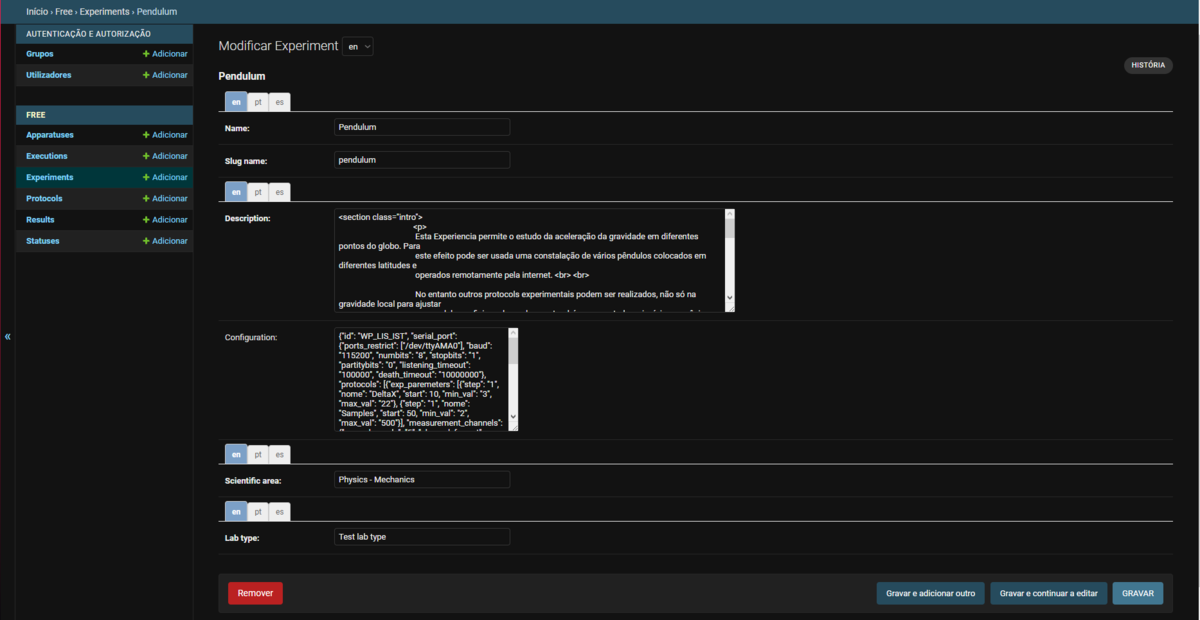
To create a new Experiment on the database is just click on the "+" on the left of the pag.
By doing that you we get to a similar pag as the above, so you need to fill the information about your experiment:
Name-> with the some of your experiment;
Slug name-> the name of the html file of your experiment (explain on the section ...);
Description-> the particular html with the description of the experiment, with the information that the user need to understand it;
Configuration-> is a JSON with basic information that the Proxy needs to know about the experiment such as the serial port that is connected (for example in the case of the experiment Pendulum);
Scientific area-> what area is the experience integrated;
Lab type-> the background needed to execute the experiment (basic, intermedium, advance).
Protocol
After finishing your Experiment you need to create a new Protocol to do that again click on the "+" next to the Protocols tab on the left.
Every Experiment should have at least one Protocol. A Protocol is a way to describe the parameters that a user can select and modify to run an experimental execution. One physical setup of an experimental can do different execution with different initial parameters so that is why one experiment can have multiple Protocols.
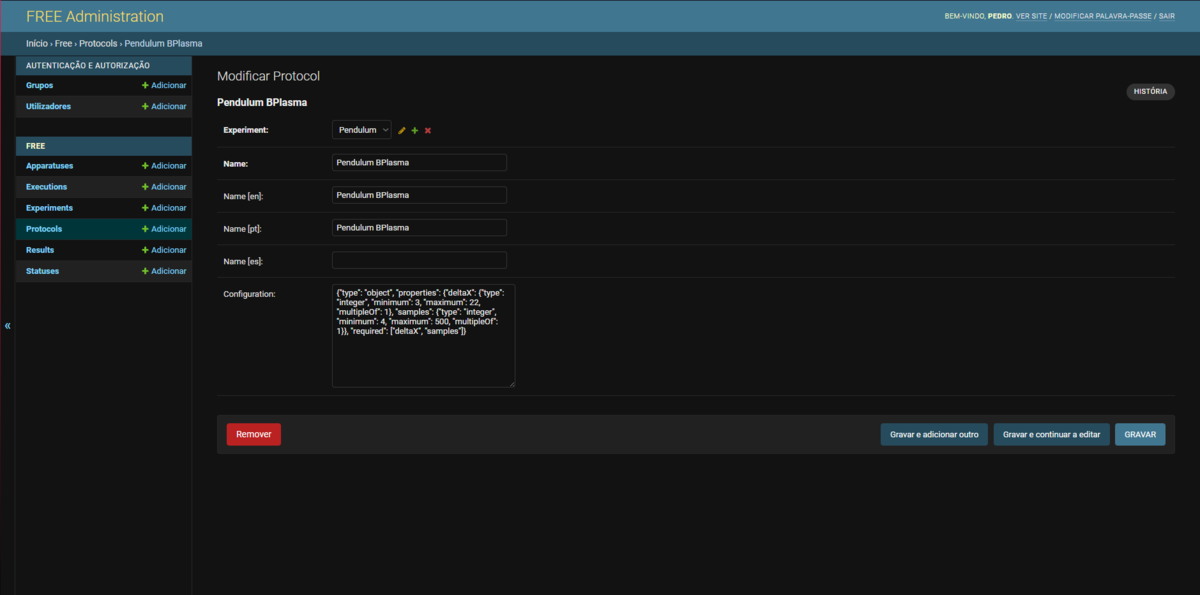
You will have a page like the one shown above that you will need to file:
Experiment-> select your exeperiment;
Name-> with the name of the protocol, this name should be descriptive of the experimental setup that the controller will use. That you can translate;
Configuration-> this is a JSON schema that will test the inputs that the user will give, and check that their configuration are within the range of the experiment ( You can do your JSON Schema here).
Apparatuses
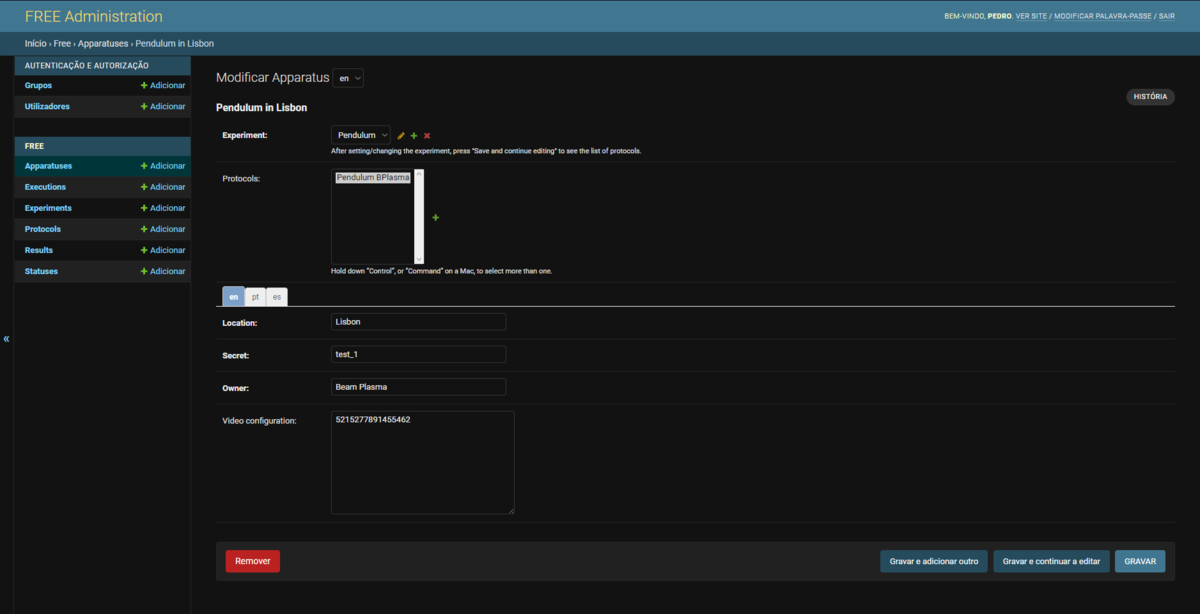
After programing the Protocols one last thing needs to be done on the database. You need to provide to the database the information of the Apparatus (the computer witch will connect to the FREE_Web).
You will have a similar page as a shown above, so you need to fill the follow information:
Experiment-> the one experiment that apparatus is connected to;
Protocol-> the protocols related that Experiment;
Location-> Location of the experiment;
Secret-> the password that you need to configure and the "server_info.ini" on the RPi_Proxy;
Owner-> the person responsible for the maintenance of the experiment;
Video Configuration -> the ID that the Port of the stream of the video is connected to the server of Janus (explained in the section ...).
HTML/JS
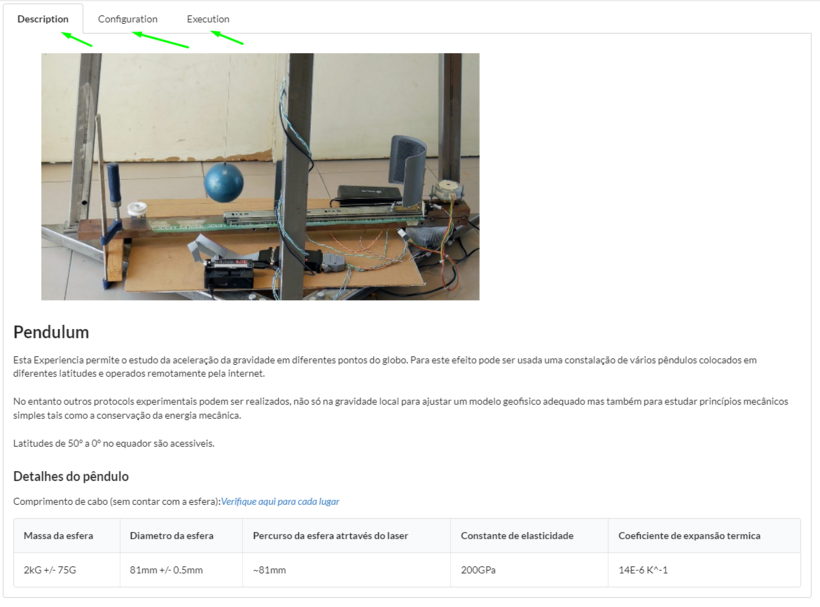
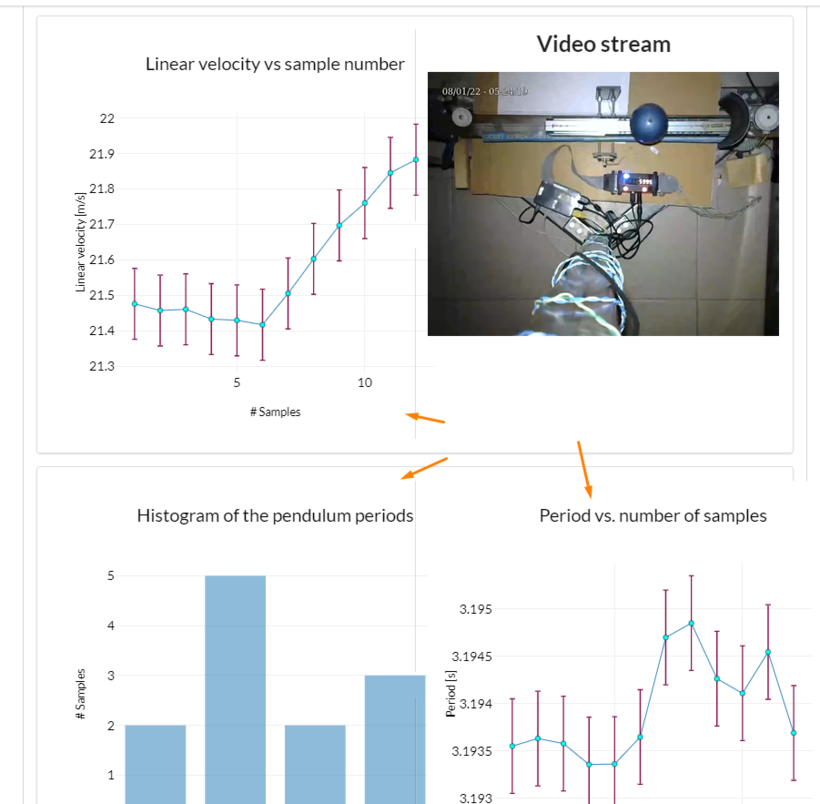
With the FREE installed you will have the following page to run an experiment Pendulum, basically it starts with a discretion that is on the database:
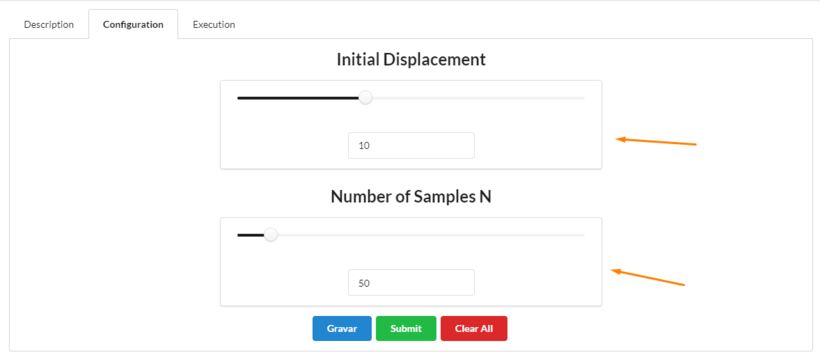
Then you can go to the Configuration tab and set up the initial condition of the experiment, and after Save and Submit the configuration
you will be sent to the tab Execution where you will be able to see the video stream and the plot of the data sent by the experiment.
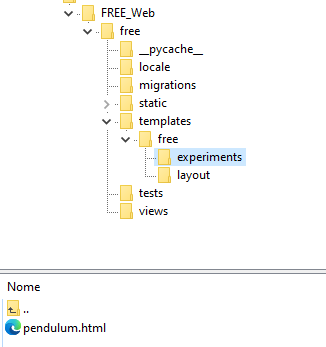
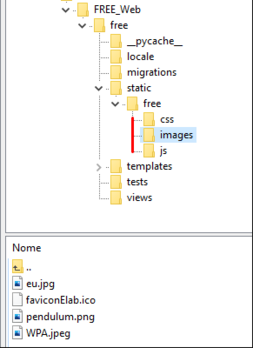
To finalize the process of creating a new experiment and adding it to the FREE you will need to do an HTML and JS similar to the one that we provide for the Pendulum experiment. Basically, you will need to add as much inputs on the Configuration tab, and change the JS that is plotting, and put the data point on a table so it displays the data points of your experiment.
After you make sure that everything is working as intended you need to add the HTML fill on the "/free/templates/free/experiments" folder and make sure that the name of the file is the same as the Slug that you put on the database ($Slug_name$.html) and the JS, image and CSS file that you need to display the HTML you will need to add them to the respective folders on the folder "/free/static/free".
