Difference between revisions of "Determination of Planck's Constant"
| Line 4: | Line 4: | ||
=Experimental Apparatus= | =Experimental Apparatus= | ||
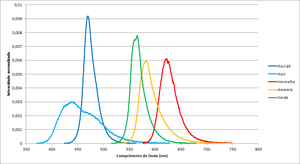
[[File:Espectro_dos_leds.png|thumb|alt=Espectro dos Leds|Figure 1: Led's spectrum.]] | [[File:Espectro_dos_leds.png|thumb|alt=Espectro dos Leds|Figure 1: Led's spectrum.]] | ||
| − | The photoelectric cell is from the apparatus PASCO AP-9368. It works like a capacitor where an electric conductor emits photoelectrons. | + | The photoelectric cell is from the apparatus PASCO AP-9368. It works like a capacitor where an electric conductor target emits photoelectrons when excited by light. |
| − | The potential of the photocell will increase with the | + | The potential of the photocell capacitor armature will increase with the emitted photoelectron accumulation. After reaching a certain voltage, the stop potential, no more photoelectrons will have enough energy to reach the second armature. This voltage will depend on the wavelength of the incident light (photon energy). |
| − | + | After each experiment the photocell is connected to ground to discharge it. | |
| − | The leds have different | + | The leds have different quantum efficiency leading to different intensities for chosen bright leading to different times to reach the stop potential. |
{| border="1" style="text-align: center;" | {| border="1" style="text-align: center;" | ||
| Line 46: | Line 46: | ||
=Protocol= | =Protocol= | ||
| − | The number of photoelectrons | + | The number of photoelectrons emitted will increase with the intensity of light. (corpuscular behaviour of light) |
#Choose a led to light up on the photocell | #Choose a led to light up on the photocell | ||
#Measure the stopping potential. Take note the time necessary to reach the maximum potential. | #Measure the stopping potential. Take note the time necessary to reach the maximum potential. | ||
| − | # | + | #Repeat step 2 for different intensities. |
{| border="1" style="text-align: center;" | {| border="1" style="text-align: center;" | ||
| − | |+ | + | |+ Example of a table |
|- | |- | ||
!Color #1 __________(name) | !Color #1 __________(name) | ||
| Line 89: | Line 89: | ||
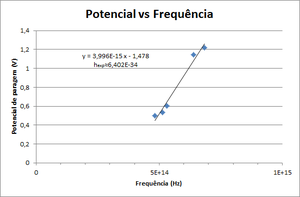
[[File:Constante de Planck.png|thumb|alt=Constante de Planck|Figure 2: Potential vs. Peaks Frequency of the spectrum ]] | [[File:Constante de Planck.png|thumb|alt=Constante de Planck|Figure 2: Potential vs. Peaks Frequency of the spectrum ]] | ||
| − | The | + | The photoelectrons kinetic energy depend only on the frequency of light. If the frequency of light increase the energy will increase . |
| − | #Obtain the stop potentials for different | + | #Obtain the stop potentials for different colour leds. |
#Draw a graphic of Stop Potential vs Frequency. Fit it to \( V = \frac{h}{e} \nu - \frac{W_0}{e} \) and obtain Planck's constant. | #Draw a graphic of Stop Potential vs Frequency. Fit it to \( V = \frac{h}{e} \nu - \frac{W_0}{e} \) and obtain Planck's constant. | ||
{| border="1" style="text-align: center;" | {| border="1" style="text-align: center;" | ||
| − | |+ | + | |+ Example of a table |
|- | |- | ||
| − | ! | + | !Colour (name) |
!Frequency (Hz) | !Frequency (Hz) | ||
| − | !Stop | + | !Stop Potential (V) |
|- | |- | ||
| | | | ||
Revision as of 23:36, 12 October 2012
Description of the Experiment
In this experiment is possible study the photoelectric effect and calculate Planck's constant by using 5 different coloured leds and a photoelectric cell.
Experimental Apparatus
The photoelectric cell is from the apparatus PASCO AP-9368. It works like a capacitor where an electric conductor target emits photoelectrons when excited by light. The potential of the photocell capacitor armature will increase with the emitted photoelectron accumulation. After reaching a certain voltage, the stop potential, no more photoelectrons will have enough energy to reach the second armature. This voltage will depend on the wavelength of the incident light (photon energy).
After each experiment the photocell is connected to ground to discharge it.
The leds have different quantum efficiency leading to different intensities for chosen bright leading to different times to reach the stop potential.
| Color | Frequency (THz) | Wavelegth (nm) | Espectros dos leds |
|---|---|---|---|
| Blue.ab | 638.7 | 469.70 | File:Espectro Azul.ab.txt |
| Blue | 684.6 | 438.20 | File:Espectro Azul.txt |
| Red | 482.2 | 622.21 | File:Espectro Vermelho.txt |
| Yellow | 514.4 | 583.16 | File:Example.txt |
| Green | 530.8 | 565.22 | File:Espectro Verde.txt |
Protocol
The number of photoelectrons emitted will increase with the intensity of light. (corpuscular behaviour of light)
- Choose a led to light up on the photocell
- Measure the stopping potential. Take note the time necessary to reach the maximum potential.
- Repeat step 2 for different intensities.
| Color #1 __________(name) | Intensity (%) | Stop Potential (V) | Time (s) |
|---|---|---|---|
| 100 | |||
| 80 | |||
| 60 | |||
| 40 | |||
| 20 |
The photoelectrons kinetic energy depend only on the frequency of light. If the frequency of light increase the energy will increase .
- Obtain the stop potentials for different colour leds.
- Draw a graphic of Stop Potential vs Frequency. Fit it to \( V = \frac{h}{e} \nu - \frac{W_0}{e} \) and obtain Planck's constant.
| Colour (name) | Frequency (Hz) | Stop Potential (V) |
|---|---|---|

