File:Paschen Config.png
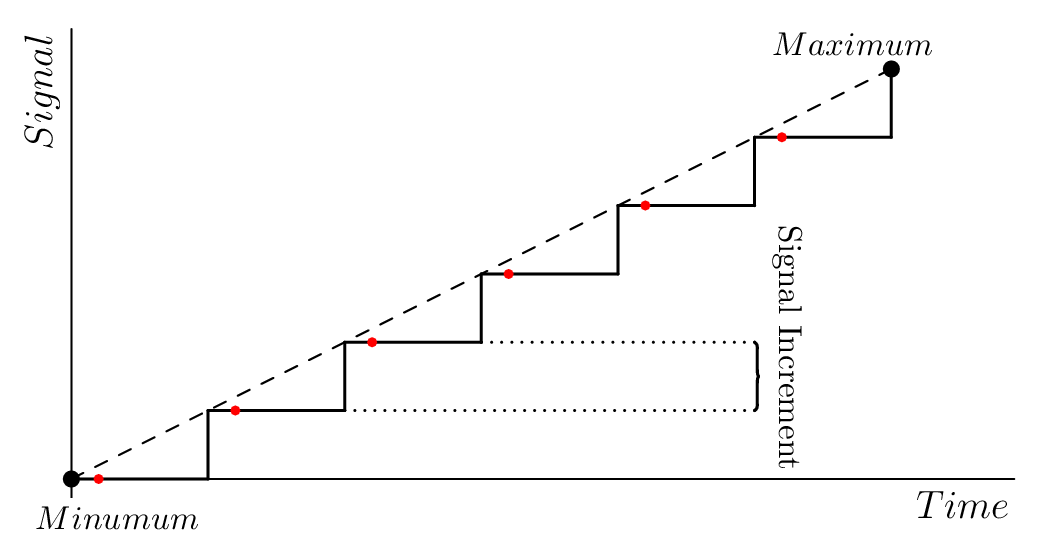
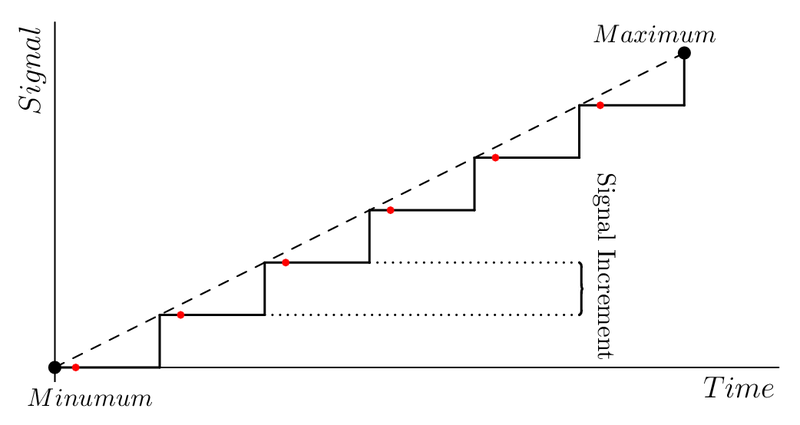
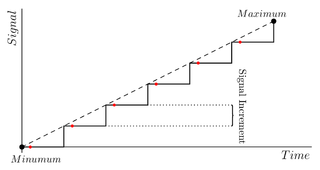
Revision as of 16:18, 30 December 2013 by Ist165696 (talk | contribs) (Diagram illustrating the variables from the sweeping signal. The red dots represent data acquisitions. The full line represents the signal generated by the hardware, while the dashed line represents the ideal signal. The smaller the step values are the cl)
Size of this preview: 800 × 425 pixels. Other resolutions: 320 × 170 pixels | 1,042 × 554 pixels.
Original file (1,042 × 554 pixels, file size: 24 KB, MIME type: image/png)
Diagram illustrating the variables from the sweeping signal. The red dots represent data acquisitions. The full line represents the signal generated by the hardware, while the dashed line represents the ideal signal. The smaller the step values are the closer the signal become to the ideal.
File history
Click on a date/time to view the file as it appeared at that time.
| Date/Time | Thumbnail | Dimensions | User | Comment | |
|---|---|---|---|---|---|
| current | 16:18, 30 December 2013 | | 1,042 × 554 (24 KB) | Ist165696 (talk | contribs) | Diagram illustrating the variables from the sweeping signal. The red dots represent data acquisitions. The full line represents the signal generated by the hardware, while the dashed line represents the ideal signal. The smaller the step values are the cl |
You cannot overwrite this file.
File usage
The following page uses this file: