Microwave plasma cavity
Contents
Description of the Experiment
Plasmas are inseparable from radio-frequency studies. Effectively the most basic properties of a plasma is derived from its plasma frequency, ωpe. As such, combining plasma physics studies with electromagnetic (EM) wave propagation is a challenging matter for physics with great advances achieved last century before space conquest due to the necessity of wave reflections on the ionosphere for long range communication. An electromagnetic cavity poses a good opportunity to understand the behavior of EM standing waves and how free charges in a plasma affects its resonant frequency and quality factor, interlinking the properties of matter with wave propagation.
Links
- Laboratory: Advanced
- Control room: [ http://elab.vps.tecnico.ulisboa.pt:8000/execution/create/3/3 Microwave cavity]
- Level: ****
Experimental Apparatus
A microwave cavity refers to a volume enclosed by a conducting surface which can store electromagnetic (EM) energy. It can be thought of as the microwave analog of an LC circuit, albeit with multiple resonance frequencies and much larger quality factors. Three main processes govern the energy losses in a cavity: conduction losses in the cavity walls, conduction loss in the dielectric material filling the cavity, and losses through access ports or holes in the conducting surface. In the first-order approximation, these losses cause the same resonance peak broadening as the resistivity losses in an RLC circuit, causing both a resonance frequency shift and a decrease in the quality factor.
Two types of resonant modes occur in electromagnetic cavities: transverse-electric modes (TE) and transverse-magnetic modes (TM). In the TE (TM) modes, the electric (magnetic) field lines are transverse to the longitudinal direction.
A comprehensive derivation of all the resonant modes of a cavity is available in chapter 6 of the book by David Pozar~\cite{Pozar2011}. In a cylindrical cavity filled by a homogeneous and isotropic medium, the resonant frequencies of the TM modes are:
\begin{equation} f_{nml}=\frac{c}{2\pi\sqrt{\mu_r\epsilon_r}}\sqrt{\left(\frac{p_{nm}}{a}\right)^2+\left(\frac{l\pi}{d}\right)^2}, \label{eq:resonant-frequency} \end{equation}
A detailed description of the cavity and all apparatus in place can be found in the paper "An accessible microwave cavity experiment for plasma density determination".
Discharge chamber
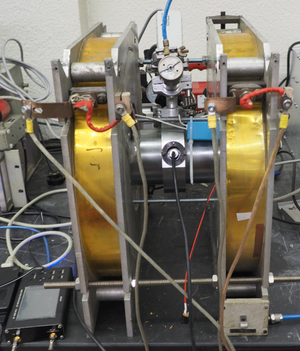
The present cavity is made of copper covered with a tiny surface of nickel to protect it against corrosion. A Cold Cathode Fluorescent Light (CCFL) inverter serves as a current source to generate a Penning discharge inside the cavity~\cite{Knauer1962}. The inverter converts a 12~V DC input to 1~kV/50kHz AC output which is applied to both the electrodes inside the cavity. This electrodes are basically an aluminum meshes and are electrically insulated from the cylinder's lateral surface and close the extremes of the cylinder (see figure). This configuration ensures that the discharge permeates the entire cavity uniformly. The CCFL inverter managed to sustain discharges with working gas pressures between ~10 and ~300Pa. The schematic in figure depicts the resonant cavity used in this experiment. The copper cylinder have a width of 64 mm diameter and 50 mm length. The cylinder bases consist of an aluminum mesh with a spacing inferior to one-tenth of the microwave wavelength used in the experiment. A spring bolted to the opposite side to the vacuum window holds the mesh in place, as shown in next figure. The whole cavity lies between two Helmholtz coils that generate a magnetic field of 1.4~mT per Ampere, up to the~maximum current of ~18A.
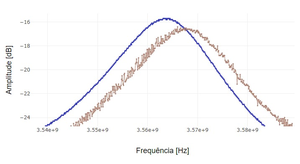
Two loop antennas lie in the middle of the cylinder wall opposite to each other. The antennas have a 4~mm radius with their axis coincident with the magnetic field line of highest intensity, the TM010 mode. One of the antennas injects the microwaves in the cavity, and the other antenna collects the propagated signal. A observed resonance is expected close to a frequency of 3560~MHz (see figure).
Vacuum and gas injection setup
The chamber is kept under vacuum by a rotary pump that can reach pressures of the order of 2 to 5Pa. The pump drives a common-rail primary vacuum distribution system. The rail connection is done by a solenoid valve, allowing for the isolation during the experiment.
The working gas flows into the chamber through another solenoid valve equipped with a capillary injector which allows to save gas usage. It is possible to select a working pressure by adjusting the valve inflow controlling carefully the opening time window. This setup has a injection rail feed by three different working gases: helium, nitrogen and argon.
Spectrum analyzer
To generate and receive the microwaves passing through the cavity, we used the inexpensive ARNIST SSA-TG R2 spectrum analyzer. The device has a frequency range from 35 to 4500 MHz with the resolution of 200 kHz. The analyzer sweeps the frequency spectrum measuring the attenuation (in dBm) for each frequency. As the generated signal for
The required number of spectra are retrieved allowing the identification and changes in the resonant frequency and Q-factor by online visualization .
Protocol
This experiment allow to determine the impact on plasma density by: (i) the influence of different atomic and molecular particles structures in the plasma generation, (ii) the effect produced by magnetic confinement and (iii) various background pressure. All this three parameters are prone to be tuned in the experiment interface. very Note that after being not used for a long time, the firsts readings may be misleading due to wall impurities, a few experiments have to be conduced in order to validate the results.
Data Analysis
The experiment return a sequence of power spectra selected by the user, usually around the first cavity's TM mode. Due to noise and because a precise value for the peak frequency is desired, the peak central frequency should be measured taking the half-difference at -3bd. Actually, the imaginary cut at -3db intercepts the spectrum's characteristic in a steeper section of the curve, allowing for a better determination. As the plasma RF generator induces some noise due to spiky effects on the electrodes (small arching spots), eventually a low-pass data filtering shall be conducted prior to extract the peak and broadness, the later for the quality factor (Q) determination.
Assuming that the resonance frequency shift Δf caused by the plasma is small with respect to the vacuum resonance frequency f010, the plasma electron density with respect to Δf is given by:
\begin{equation} n_e = \frac{8\pi^2m_e\epsilon_0}{e^2}f_{010}\Delta f. \label{eq:freq-shift} \end{equation}
If an external magnetic field is present, this equation is only valid as long as the electric field of the mode is parallel to the external magnetic field. This approximation further assumes that the plasma does not change the shape of the mode's electric field.
Nevertheless, when an external magnetic field is applied and due to confinement, it is visually clearly seen that the plasma stays aside from the walls leading to a reduced effective chamber diameter filled with plasma. Three values of magnetic field are available to study this effect (0T, 20mT, 25mT).
Expected results are presented in the figure. Several types of experiments can be conducted by selecting different pressures and gases (plasma color should always be checked in the webcam to confirm the correct gas being injected).

